Showing posts with label Race for renewable energy. Show all posts

Thursday, August 14, 2014

We need to rethink how we support renewable energy

Chris Goodall
11th August 2014

Feed-in tariffs are a great way to kick start renewable technologies, writes Chris Goodall. But they suffer from a law of exponentially diminishing returns. It's time for governments to move to direct R&D funding to achieve the transformational changes the world needs.

The renewable industries are now addicted to their own guaranteed cash streams from government and have growing lobbying power. The genuine innovation that we need is in danger of never happening.
Is it right to drive cost reductions in renewable technologies by use of direct production subsidies that are adding increasing amounts to domestic bills?
Or should we be spending more, much more, on fundamental research and development?
The argument is this. Broadly speaking, we can achieve cost improvements in any technology either by accumulating production experience (usually called 'the learning curve') or by targeting improvements in technology.
It is often difficult to disentangle the two phenomena but I still think the distinction is useful. Put another way, should we trying to cut prices by 'learning by doing' or by 'learning by research'?
Feed-in Tariffs emerged as the popular solution
Governments around the world have backed away from energy research. In the 1970's administrations that had been frightened by the OPEC oil embargo put big sums into R&D, particularly into nuclear but also into wind.

Outside France, that investment largely failed, and failed catastrophically. Energy R&D then plummeted around the world. A decade ago, UK energy research was costing just a few tens of millions a year. (It has gone up somewhat since).

Thursday, November 14, 2013


Solar power is becoming more competitive with conventional sources of energy. Due to economies of scale and, in part, China's overproduction, the price of solar panels has fallen dramatically.And owing to technological advancement, they are more efficient. Some industry analysts expect solar energy could provide as much as 18% of energy needs in parts of Europe.   This first Great Graphic comes from an article by Pilita Clark of the Financial Times.


Germany is one of the leading countries in the use of renewable energy.  It is home to about a third of the photovoltaic capacity, which accounted for an estimated 5% of the country's energy needs in 2012, up from 3% in 2011.  Overall, renewable energy accounted for a little more than a fifth of Germany's energy needs last year, while natural gas share slipped to 11% from 14%. 

Globally, the electricity produced by solar energy has grown 4-fold over the past decade form 2.8 gigawatts to 102 gigawatts.  Industry expert project a doubling by 2016.  The price per watt has fallen precipitously from $70 a watt (in 2012 dollars), when first introduced in the 1970s, to 80 cents a watt now.   Prices have fallen nearly 80% in the past five years alone.  

This second Great Graphic is part of a larger chart by Thomson Reuters.   It shows the wind energy capacity globally as of the end of last year.  The EU's wind energy capacity was a little larger than China, India and Canada's combined.  China's wind energy capacity outstrips the US.  Another way of looking at it, the EU, China and the US account for 7/8 of the world's wind energy capacity.  


This last Great Graphic shows the the growth of land-based wind power in the US (purple line) and the sharp drop in the cost of generating a kilowatt hour of electricity.  It comes from the Climate Group's website thecleanrevolution.org.  

Drawing on data from the Department of Energy, Climate Group reports that US-land based wind energy capacity has grown three-fold between 2008 and 2012 to 60 gigawatts.  US solar capacity grew 10-fold over the same period. 

Solar energy was Europe's fastest growing source of electricity in 2012 (for the third year running), while wind power overtook solar power 2012 as the America's fastest growing new source of electricity.   By 2030, the DOE estimates that as much as a fifth of US electricity demand could be met by wind power.  

Sunday, May 26, 2013


Can renewables power post-nuclear Germany?

by Erik Gawel & Sebastian Strunz
When the Fukushima Daiichi nuclear power plant in Japan was hit by a tsunami in March 2011, the disaster had a profound effect on German energy policy. Chancellor Angela Merkel reasoned that “Fukushima has forever changed the way we define risk in Germany.”
Three days after the news of meltdown in three of Fukushima’s reactors, Chancellor Merkel drew a line under German nuclear power. The seven oldest nuclear power plants in Germany were immediately taken off the grid, and two months later the government made this permanent. The remaining German nuclear power plants, it was decided, would be shut down by 2022.
This decision was a spectacular policy U-turn, as the same conservative government had only recently overturned an earlier attempt to ban nuclear power in Germany. In 2010, Chancellor Merkel’s coalition had argued that nuclear power was a “bridge technology”necessary to pave the way towards a carbon-free energy system. The prolonged use of nuclear power would be indispensable in order to guarantee security of supply, it was claimed.
This raises two questions: did removing seven power plants endanger the security of supply to the German national grid? And what convincing long-term strategy is there in place to manage the shift to carbon-free energy without nuclear power?
The loss of the power stations cut the nuclear contribution to the country’s energy by about a quarter, from 22% in 2010 to 16% in 2012. Yet Germany is still a net exporter of electricity, and the power not generated due to the shutdown has not led to a requirement to import foreign nuclear power. The key findings of a detailed study by the Institute for Applied Ecology on this matter clearly demonstrated this, where the authors stated that: “The existence of power imports is not an indication that the (domestic) security of supply is in jeopardy. The shutdown of nuclear power plants has not resulted in increased imports of power from foreign nuclear power plants and thus has not been counterbalanced by foreign power imports.”

Thursday, May 16, 2013


Page 1 of 3

Saturday, May 11, 2013


Pathways to 100 Percent Renewable Energy

By John Berger, Contributor 
April 30, 2013   |   17 Comments


Graph of the Day: Why renewables are disruptive, in a good way


A common refrain, from skeptics to allies alike, is that renewable energy is a great idea, but not feasible because oil, gas, and coal will always be cheaper. Leaving aside the fact that fossil fuels are a finite resource and are the primary driver behind a warming planet, is it really true that renewable energy is more expensive?Climate Progress
Brian McConnell made a graph that shows what has happened to the price of energy (in gigajoules) since 1980 for solar power, natural gas, crude oil, and then residential electricity.
disruptive-solar
In his words:
The graph above compares the price history of solar energy to conventional energy sources. This is what a disruptive technology looks like. While conventional energy prices remained pretty flat in inflation adjusted terms, the cost of solar is dropping,fast, and is likely to continue doing so as technology and manufacturing processes improve.
That green line drops steadily. Though it represents a very tiny proportion of the total energy mix, as it gets cheaper and cheaper we can expect that to change. Disruptively. One thing McConnell said he would like to update is prices for coal, which would be interesting.
In an update, he noted that while joules are a good leveling metric, one thing they do not capture is the fact that many of those joules of fossil fuel energy are burned as waste heat, increasing the price. Solar placed in less sunny places than the American South would also increase the price.
His graph is backed up by the pros. In Bloomberg New Energy Finance’s presentation (pdf) to the Clean Energy Ministerial last month, this slide shows that solar panel prices fell 80 percent in the last 5 years:
BNEFsolar-e1367856087416
It’s not just solar. This one shows the steady decline in wind turbine prices – 29 percent since 2008:
BNEFwindprices
The skeptic might say “that’s all well and good, but storage technology is not feasible and what exists today is far too expensive — some cars will always need gasoline.” Not so: lithium-ion battery costs dropped 40 percent in the last three years:
BNEFbatteryprices

Thursday, April 18, 2013


US grid could run reliably on majority renewables by 2050: study

by Sophie Vorrath

A new American study has found that, by the year 2050, the US electricity grid could shut down all of its coal-fired power plants, a quarter of its nuclear power plants, reduce its reliance on gas, and run reliably and cost-effectively on a majority of renewable energy sources.
The report – prepared by Synapse Energy Economics for the nonprofit Civil Society Institute – has found that, in a 2050 US energy scenario, with a heavy reliance on renewables, regional electricity generation supply could meet or exceed demand in 99.4 percent of hours, with load being met without imports from other regions and without turning to reserve storage. In addition, surplus power would be available to export in 8.6 per cent of all hours, providing an ample safety net where needed from one region of the US to the next.
The report follows on from a 2011 study by Synapse which introduced a “Transition Scenario” in which the US retires all of its coal plants and a quarter of its nuclear plants by 2050, moving instead toward a power system based on energy efficiency and renewable energy.
Screen Shot 2013-04-18 at 11.13.46 AM
Not unlike the UNSW 100% renewables study here in Australia, the SCI-commissioned 2011 study showed that this scenario, in addition to achieving significant reductions in CO2 emissions, would ultimately cost American society less than a “business as usual” strategy – even without considering the cost of carbon – and could actually result in savings of $US83 billion.
According to the SCI, the new study takes the 2011 analysis "one big step farther," to explore the extent to which the Transition Scenario's "variable output" resource mixes, such as large-scale wind and solar, for 2030 and 2050 are capable of meeting projected load for each of the 10 studied US regions.
"This study finds that the projected mixes, based entirely on existing technology and operational practices, are capable of balancing projected load in 2030 and 2050 for each region-in nearly every hour of every season of the year," said report co-author Dr Thomas Vitolo, an analyst at Synapse.

Renewable Germany: The very model of the new energy order


Germany has doubled the renewable share of its total electricity consumption in the past six years to 23% in 2012. It forecasts nearly a redoubling by 2025, well ahead of the 50% target for 2030, and closing in on official goals of 65% in 2040 and 80% in 2050. Some areas are moving faster: in 2010, four German states were 43–52% windpowered for the whole year. And at times in spring 2012, half of all German electricity was renewable, nearing Spain’s 61% record set in April 2012.While the examples of Japan, China, and India show the promise of rapidly emerging energy economies built on efficiency and renewables, Germany—the world’s number four economy and Europe’s number one—has lately provided an impressive model of what a well-organized industrial society can achieve. To be sure, it’s not yet the world champion among countries with limited hydroelectricity: Denmark passed 40% renewable electricity in 2011 en route to a target of 100% by 2050, and Portugal, albeit with more hydropower, raised its renewable electricity fraction from 17% to 45% just during 2005–10 (while the U.S., though backed by a legacy of big hydro, crawled from 9% to 10%), reaching 70% in the rainy and windy first quarter of 2013. But these economies are not industrial giants like Germany, which remains the best disproof of claims that highly industrialized countries, let alone cold and cloudy ones, can do little with renewables.

Efficiency and Renewables Bolster Post-Fukushima Germany
To underscore the remarkable German case, let’s review what happened in 2011, right after Fukushima. The Bundestag—led by the most conservative and pro-nuclear party, with no party dissenting—overwhelmingly voted to close eight of the country’s nuclear plants immediately and the other nine by 2022. (In a double U-turn, a nuclear phase-out agreed in 2000 was first slowed and then reinstated; nuclear output has actually been falling since 2006.) Skeptics said this abrupt shutdown of 41% of nuclear output would make the lights go out, the economy crash, carbon emissions and electricity prices soar, and Germany need to import nuclear power from France. But none of that happened.
In fact, in 2011 the German economy grew three percent and remained Europe’s strongest, buoyed by a world-class renewables industry with 382,000 jobs (about 222,000 of them added since 2004, with net employment and net stimulus both positive). Chancellor Merkel won her bet that it would be smarter to spend energy money on German engineers, manufacturers, and installers than to send it to the Russian natural gas behemoth Gazprom. Germany’s lights stayed on. The nuclear shutdown was entirely displaced by year-end, three-fifths due to renewable growth. Do the math: simply repeating 2011’s renewable installations for three additional years, through 2014, would thus displace Germany’s entire pre-Fukushima nuclear output. Meanwhile, efficiency gains—plus a mild winter—cut total German energy use by 5.3%, electricity consumption by 1.4%, and carbon emissions by 2.8%. Wholesale electricity prices fell 10–15%. Germany remained a net exporter of electricity, and during a February 2012 cold snap, even exported nearly 3 GW to power-starved France, which remains a net importer of German electricity.
Was this just a flash in the pan? No. In 2012 vs. 2011, official data show that these trends broadly persisted.
Germany generated 617 TWh of electricity in 2012, up 0.3% from 2011. Nuclear generation fell below 100 TWh, the lowest in at least two decades. Gas prices spiked above coal, so gas-fired generation fell 13 TWh while coal-fired generation ticked up 14 TWh or 5%—still near modern lows, but boosted by a record 23 TWh of profitable power exports. Renewables added 15 TWh: they rose from 20% of electricity consumption in 2011 to 23% in 2012, passing every rival except brown coal (lignite, expected to recede in 2013). Renewable output has risen by one-third just in the past two years. And though Germany’s mix of solar, wind, biomass, hydro, etc. wouldn’t all run at the same time, its total end-of-2012 renewable generating capacity impressively rivaled the country’s 82 GW peak demand. Driven by renewables’ competition, wholesale electricity prices continued to plummet. Germany’s grid remained the most reliable in Europe. And while real GDP, damped by the Euro crisis, grew just 0.7%, electricity consumption fell 1.3%. Total carbon emissions rose 1.6%, boosted by an unusually cold winter, but emissions from industry plus power stations stayed constant, and weather-adjusted total emissions probably fell.

Monday, February 18, 2013


Electricity emissions fall as coal sidelined by renewables


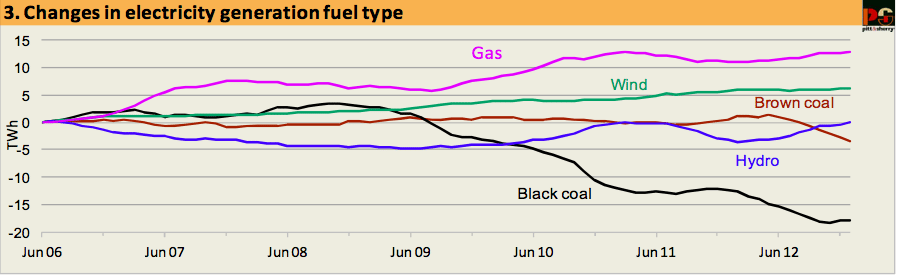
In its latest assessment of Australian electricity production and emissions, consulting group Pitt&Sherry said even production from highly polluting brown coal generators has fallen in the past 12 months. Part of this was due to floods at the Yallourn mine in June,Emissions from Australia’s National Electricity Market (NEM) have fallen to 10 year lows, as demand continues to ease and the amount of coal reduction falls because of the growth of renewable energy, which has reached its highest levels since the 1980s.

The report notes that a 500MW unit at the Wallerawang C power station near Lithgow in NSW has also been mothballed, for at least 12 months, as a result of the changing dynamics of the NEM. This adds to the near 3,000MW of coal-fired capacity put on hold in the past year.
The latest data (illustrated in the graph below) shows that gas, hydro and wind generators have all increased output, with the Tasmanian hydro system reaching its highest level since joining the NEM in 2005, taking total hydro electricity production to it highest levels since 2000-01.
Screen Shot 2013-02-13 at 11.07.17 AM
Wind energy generation fell slightly in January from December, but Pitt&Sherry said the commissioning of the 420MW Macarthur wind farm in Victoria would push wind output to its highest levels in the next month or so.
Gas generation also reached its highest ever annualized levels in January. “These are precisely the changes in the electricity supply mix which the carbon price would be expected to induce,” the report said.
Total renewables (hydro plus wind) reached 12.1 per cent of NEM generation in the year to January 2013. This is the highest share of renewable supply in what is now the NEM since the 1980s, when total demand for electricity was less than 60 per cent of its current level.
“This fact highlights that the growing share of electricity supplied by low emission generators in the NEM, and the corresponding fall in average emissions intensity of total NEM generation to its lowest ever level, is due as much to the fall in demand for electricity from the NEM as to the increased output from low emission generators themselves,” the report said.
“Had demand kept growing at the rates seen up to the end of 2006, the shares of gas, hydro and wind generation would have been significantly lower, for the same total output, and the emissions intensity of NEM generation higher. “
The report notes that the biggest falls in demand have occurred in NSW and Victoria, with demand in SA and Tasmania virtually unchanged for more than four years.

Friday, January 25, 2013


Thursday, January 24, 2013


Thursday, December 6, 2012


Thursday, November 22, 2012


Friday, November 2, 2012


Renewable energy will overtake nuclear power by 2018, research says

(guardian- 30 Oct 12) Renewables will provide enough power for one in 10 British homes by 2015 if current growth rates continue.
Renewable energy capacity will overtake nuclear power in the UK by 2018, if current rates of growth continue, and will provide enough power for one in 10 British homes by 2015, according to new research.
The amount of electricity supplied by wind energy alone is up by a quarter since 2010, in a surprisingly good year for the renewables industry. While the government has notably cooled on wind power – more than 100 Tory MPs signed a statement this year opposing new windfarms, and the chancellor of the exchequer, George Osborne, has queried the future of subsidies – the industry has continued to grow, with investment in offshore wind up by about 60% to £1.5bn in the past year. Planning approvals for onshore windfarms also rose, up by about half, to reach a record level, according to the trade association Renewable UK.

Thursday, November 1, 2012


UK renewable energy capacity to equal thermal by 2025

1 November 2012 - Growing government support, combined with significant untapped potential, could see the UK’s renewable energy installed capacity almost match that of the traditionally dominant thermal sector by 2025, says research by energy expert GlobalData. It predicts that the cumulative installed capacity of renewable energy plants will reach 79,000 MW by 2025 – just 2,000 MW less than the predicted thermal installed capacity for the same year.
The renewable energy industry is the fastest growing segment in the UK’s power mix, and is set to grow from the 11,000 MW installed capacity recorded for 2011.Wind is expected to be the country’s major contributing renewable power source in the future, surging from 6,000 MW in 2011 to reach 53,000 MW by the quarter-century point.
The UK is in an ideal location for generating wind power and is a global leader in the sector. The government has provided impressive support for the development of offshore wind energy farms and hopes to capitalise on this readily available resource.
Solar photovoltaics (PV) is also expected to exhibit strong growth in the future, climbing from just over 1,000 MW in 2011 to 13,338 MW installed capacity in 2025.